Are shuffled plays random? by Mark Seemann
Have you ever asked your music player to shuffle all your music, only to wonder: didn't it play that song only yesterday?
When I work, I often listen to music. Sometimes, I make a deliberate choice, but often, I just ask my music player to shuffle my entire music library.
It invariably happens that it plays a song it played only a couple of days before; I often notice when it's a song I don't like, because then it annoys me that it plays that stupid song again. Given that I have more than 16,000 tracks, and approximately 5,000 tracks on my laptop, it seems unlikely that the music player should pick the same track within only a few days.
This is a well-known phenomenon known as frequency illusion, or more colloquially as the Baader-Meinhof Phenomenon. Your brain seeks patterns, even where no patterns exist. This is a really strong feeling, it turns out.
When tracks are played in truly random fashion, it's as unlikely that it should play two tracks far apart as it should play them close together. Therefore, many media players come with shuffle algorithms that are not random, but designed to feel random.
With my thousands of tracks, I couldn't shake the feeling that my player's shuffle algorithm was one of those non-random algorithms, so I decided to analyse my plays.
Getting the data in shape #
Fortunately, I've been scrobbling my plays to Last.fm since 2007, so I had comprehensive statistics to work with.
There's a third-party service where you can download all your Last.fm scrobbles as a CSV file, so I did that; all 53,700 scrobbles.
This file contains all my scrobbles since 2007, but I had to clean it up:
- I haven't used the same music player in all those years, so I decide to only look at the entries since January 1, 2014. I know I've only used one player in that period.
- It often happens that I put on a particular artist, album, or playlist, and I had to remove those, because I wanted to look at only the entries when I was listening in shuffle mode.
Analysing with F# #
Next, I created an F# script file, and read in the file's contents:
open System
open System.IO

type Track = { Artist : string; Album : string; Name : string }

type Scrobble =
    { Track : Track; Time : string }

let parse (line : string) =
    match line.Split '|' with
    | [| artist; album; track; time |] ->
        Some {
            Track = { Artist = artist; Album = album; Name = track }
            Time = time }
    | _ -> None

let scrobbles =
    File.ReadAllLines @"Last.fm_ploeh_shuffled.csv"
    |> Array.map parse
This script reads the file, with each line an element in an array. It then parses each line into Scrobble values. There may be parse errors, if a line contains the wrong number of elements, but this turned out to not be the case:
> let hasParseErrors = scrobbles |> Array.exists (Option.isNone);;
val hasParseErrors : bool = false
The next step was to group the scrobbles into distinct tracks, with a count of each track:
let counts =
    scrobbles
    |> Array.choose id
    |> Array.countBy (fun s -> s.Track)
    |> Array.sortByDescending snd
This gave me a sorted 'hit list', showing me the songs played the most in the top of the list. Here's the top 10:
DJ Zen, Peace Therapy, Anamatha (Intro)                                : .......
Abakus, That Much Closer to the Sun, Igmatik                           : .......
Yoji Biomehanika, Technicolor Nrg Show, seduction (sleep tonight remix): ......
Mindsphere, Patience for Heaven. CD 2: Inner Cyclone, inner cyclone    : ......
Massive Attack, Mezzanine, Black Milk                                  : ......
Dimension 5, TransAddendum, Strange Phenomena                          : ......
Dire Straits, Brothers in Arms, Your Latest Trick                      : ......
Digicult, Out Of This World, Star Travel                               : ......
Infected Mushroom, Classical Mushroom, Bust A Move                     : ......
Brother Brown feat. Frank'ee, Under The Water, Under The Water (Or[...]: ......
None of these, with the exception of Under The Water, are particular favourites of mine, so I don't think these were tracks I'd definitely selected; remember: I'd made a deliberate effort to remove such tracks before starting the analysis.
This list tells me something, because I know what I like and don't like, but it doesn't tell me much about the distribution of tracks. The two most 'popular' tracks had been played 7 times over the last two years, and the remaining tracks 6 times. How about the other 5,155 entries in counts? How were they distributed?
It's easy to count how many tracks were played 7 times, how many were played 6 times, 5 times, etc.:
> let frequencyCounts = counts |> Array.countBy snd;;

val frequencyCounts : (int * int) [] =
  [|(7, 2); (6, 9); (5, 43); (4, 159); (3, 561); (2, 1475); (1, 2916)|]
It looks as though the 'popular' tracks are rare occurrences. Most tracks (2,916) were played only once, and 1,475 only twice. This is perhaps easier to understand when visualised.
Visualisation #
While there are great visualisation packages for F#, for this ad-hoc task, I found it easier to use Excel. After all, I only had 7 observations to plot:
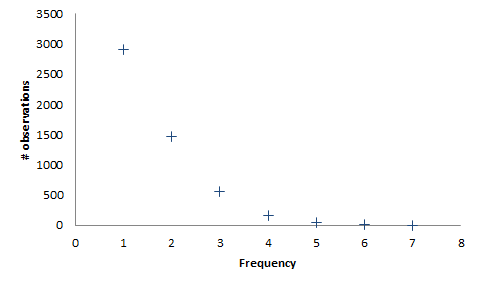
This figure shows that almost 3,000 tracks were scrobbled only once, approximately 1,500 were scrobbled twice, 500 or so were scrobbled thrice, and so on.
Even if we expect the distribution to be entirely uniform, we should expect to see duplicates. While I have more than 16,000 tracks on my home system, I only have some 5,000 tracks on my laptop, and these are the tracks for which I have data. Since I had 8,500 scrobbles to analyse, there must be duplicates, but we shouldn't expect to see two plays being more common than one, because even with an even distribution, you can't play all tracks twice when you have 5,000 tracks, but 'only' 8,500 plays.
That there are some 500 tracks that have been played three times don't seem unlikely in this light. Furthermore, outliers are to be expected as well; while they're there, the figure also shows that they promptly taper off to insignificance.
Although I took theoretical statistics in university (I had to), I never liked it, and got the lowest passing grade. In other words: don't trust any of this. I haven't formally analysed it with proper statistical tools.
Conclusion #
Still, based on this little Friday exercise, I now feel renewed confidence that my music player does, indeed, pick tracks at random when I tell it to play all songs shuffled.
