Functions as pipes by Mark Seemann
A visual metaphor.
A recent article on types as sets briefly touched on functions as sets. For example, you can think of Boolean negation as a set of two arrows:

Here the arrows stay within the set, because the function is a function from the set of Boolean values to the set of Boolean values.
In general, however, functions aren't always endomorphisms. They often map one set of values to another set. How can we think of this as sets?
As was also the case with the article on types as sets, I'd like to point out that this article isn't necessarily mathematically rigorous. I'm neither a computer scientist nor a mathematician, and while I try to be as correct as possible, some hand-waving may occur. My purpose with this article isn't to prove a mathematical theorem, but rather to suggest what I, myself, find to be a useful metaphor.
Boolean negation visualised with domain and codomain #
Instead of visualising Boolean negation within a single set, we can also visualise it as a mapping of elements from an input set (the domain) to an output set (the codomain):
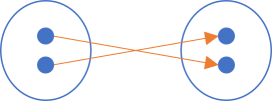
In this figure, the domain is to the left and the codomain is on the right.
How do we visualise more complex functions? What if the domain isn't the same as the codomain?
Boolean and #
Let's proceed slowly. Let's consider Boolean and next. While this function still involves only Boolean values, it combines two Boolean values into a single Boolean value. It'd seem, then, that in order to visualise this mapping, we'd need two sets to the left, and one to the right. But perhaps a better option is to visualise the domain as pairs of Boolean values:

To the left, we have four pairs that each map to the Boolean values on the right.
Even numbers #
Perhaps using only Boolean values is misleading. Even when dealing with pairs, the above example may fail to illustrate that we can think of any function as a mapping from a domain to a codomain.
Imagine that there's such a thing as a 3-bit number. Such a data structure would be able to represent eight different numbers. To be clear, I'm only 'inventing' such a thing as a 3-bit number because it's still manageable to draw a set of eight elements.
How would we illustrate a function that returns true if the input is an even 3-bit number, and false otherwise? We could make a diagram like this:
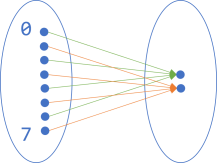
On the left-hand side, I've only labelled two of the numbers, but I'm sure you can imagine that the rest of the elements are ordered from top to bottom: 0, 1, 2, 3, 4, 5, 6, 7. To the right, the two elements are true (top) and false (bottom).
Given this illustration, I'm sure you can extrapolate to 32-bit integers and so on. It's impractical to draw, but the concept is the same.
Encoding #
So far, we've only looked at functions where the codomain is the set of Boolean values. How does it look with other codomains?
We could, for example, imagine a function that 'encodes' Boolean values as 3-bit numbers, false corresponding (arbitrarily) to 5 and true to 2. The diagram for that function looks like this:
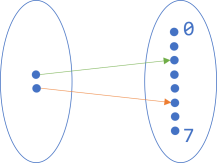
Now the set of Boolean values is on the left, with true on top.
A function as a pipe #
In all examples, we have the domain to the left and the codomain on the right, connected with arrows. Sometimes, however, we may want to think about a function as just a single thing, without all the details. After all, the diagrams in this article are simple only because the examples are toy examples. Even a simple function like this one would require a huge diagram:
public static bool IsPrime(int candidate)
An input type of int corresponds to a set with 4,294,967,296 elements. That's a big set to draw, and a lot of arrows, too!
So perhaps, instead, we'd like to have a way to illustrate a function without all the details, yet still retaining this set-based way of thinking.
Let's return to one of the earlier examples, but add a shape around it all:
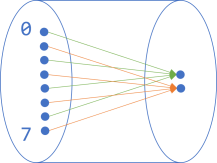
This seems like a fair addition to make. It starts to look like the function is enclosed in a pipe. Let's make the pipe opaque:
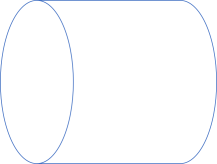
In architecture diagrams, a horizontal pipe is a common way to illustrate that some sort of data processing takes place, so this figure should hardly be surprising.
Composition #
You may say that I've been cheating. After all, in a figure like the one that illustrates an isEven function, the domain is larger than the codomain, yet I've kept both ovals of the same size. Wouldn't the following be a fairer depiction?
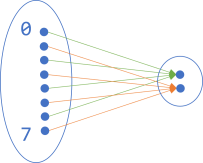
If we try to enclose this diagram in an opaque pipe, it'd look like this:
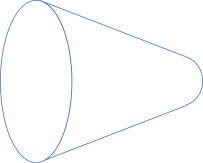
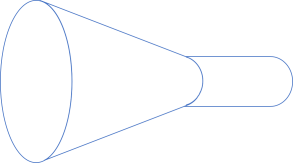
This mostly looks like a (bad) perspective drawing of a pipe, but it does start to suggest how functions fit together. For example, the output of this isEven function is the Boolean set, which is also the input of, for example the Boolean negation function (! or not). This means that if the shapes fit together, we can compose the pipes:
Continuing this line of thinking, we can keep on composing the shapes as long as the output fits the input of the next function. For example, the output of Boolean negation is still the Boolean set, which is also the domain of the above 'encoding' function:
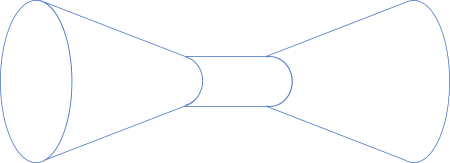
We can even, if we'd like to peek into the composition, make the pipes transparent again, to illustrate what's going on:
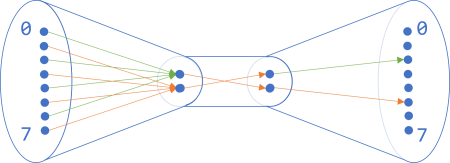
As long as the right-hand side of one pipe fits the left-hand side of another pipe, it indicates that you can compose these two functions.
Haskell translation #
For completeness' sake, let's try to express these three functions, as well as their composition, in a programming language. Since Haskell already comes with a composition operator (.), it fits nicely. It also already comes with two of the three functions we'll need:
even :: Integral a => a -> Bool

not :: Bool -> Bool
Thanks to Haskell's type-class feature, even works for any Integral instance, so if we imagine that our hypothetical 3-bit number is an Integral instance, it'll work for that type of input as well.
The remaining function is trivial to implement:
encode :: Num a => Bool -> a
encode  True = 2
encode False = 5
Since Integral is a supertype of Num, if our 3-bit number is an Integral instance, it's also a Num instance.
The composition implied by the above figure is this:
composition :: Integral a => a -> a
composition = encode . not . even
Haskell is typically read from right to left, so this composition starts with even, continues with not, and concludes with encode.
Let's call it:
> composition 3
2
> composition 4
5
composition 3 first passes through even, which returns False. False then passes through not, which returns True. Finally, True passes through encode, which returns 2.
I'll leave the exegesis of composition 4 as an exercise for the reader.
C# translation #
In C#, imagine that an Int3 data type exists. You can now define the three functions like this:
Func<Int3, bool> isEven = number => number.IsEven;
Func<bool, bool> not = b => !b;
Func<bool, Int3> encode = b => b ? (Int3)2 : (Int3)5;
Given a Compose extension method on Func<A, B>, you can now compose the functions like this:
Func<Int3, Int3> composition = isEven.Compose(not).Compose(encode);
This composition works just like the above Haskell example, and produces the same results.
Conclusion #
A function takes input and returns output. Even if the function takes multiple arguments, we can think of an argument as a single object: a tuple or Parameter Object.
Thus, we can think of a function as a mapping from one set to another. While we can illustrate a specific mapping (such as even, not, and encode), it's often useful to think of a function as a single abstract thing. When we think of functions as mappings from sets to sets, it makes intuitive sense to visualise the abstraction as a pipe.
This visual metaphor works for object-oriented programming as well. With sufficient mental gymnastics, functions are isomorphic to methods, so the pipe metaphor works beyond pure functions.
