Extracting data from a small CSV file with Python by Mark Seemann
My inept adventures with a dynamically typed language.
This article is the third in a small series about ad-hoc programming in two languages. In the previous article you saw how I originally solved a small data extraction and analysis problem with Haskell, even though it was strongly implied that Python was the language for the job.
Months after having solved the problem I'd learned a bit more Python, so I decided to return to it and do it again in Python as an exercise. In this article, I'll briefly describe what I did.
Reading CSV data #
When writing Python, I feel the way I suppose a script kiddie might feel. I cobble together code based on various examples I've seen somewhere else, without a full or deep understanding of what I'm doing. There's more than a hint of programming by coincidence, I'm afraid. One thing I've picked up along the way is that I can use pandas to read a CSV file:
data = pd.read_csv('survey_data.csv', header=None)
grades = data.iloc[:, 2]
experiences = data.iloc[:, 3]
In order for this to work, I needed to import pandas. Ultimately, my imports looked like this:
import pandas as pd
from collections import Counter
from itertools import combinations, combinations_with_replacement
import matplotlib.pyplot as plt
In other Python code that I've written, I've been a heavy user of NumPy, and while I several times added it to my imports, I never needed it for this task. That was a bit surprising, but I've only done Python programming for a year, and I still don't have a good feel for the ecosystem.
The above code snippet also demonstrates how easy it is to slice a dataframe into columns: grades contains all the values in the (zero-indexed) second column, and experiences likewise the third column.
Sum of grades #
All the trouble I had with binomial choice without replacement that I had with my Haskell code is handled with combinations, which happily handles duplicate values:
>>> list(combinations('foo', 2))
[('f', 'o'), ('f', 'o'), ('o', 'o')]
Notice that combinations doesn't list ('o', 'f'), since (apparently) it doesn't consider ordering important. That's more in line with the binomial coefficient, whereas my Haskell code considers a tuple like ('f', 'o') to be distinct from ('o', 'f'). This is completely consistent with how Haskell works, but means that all the counts I arrived at with Haskell are double what they are in this article. Ultimately, 6/1406 is equal to 3/703, so the probabilities are the same. I'll try to call out this factor-of-two difference whenever it occurs.
A Counter object counts the number of occurrences of each value, so reading, picking combinations without replacement and adding them together is just two lines of code, and one more to print them:
sumOfGrades = Counter(map(sum, combinations(grades, 2)))
sumOfGrades = sorted(sumOfGrades.items(), key=lambda item: item[0])
print(f'Sums of grades: {sumOfGrades}')
The output is:
Sums of grades: [(0, 3), (2, 51), (4, 157), (6, 119), (7, 24), (8, 21), (9, 136), (10, 3),
                 (11, 56), (12, 23), (14, 69), (16, 14), (17, 8), (19, 16), (22, 2), (24, 1)]
(Formatting courtesy of yours truly.)
As already mentioned, these values are off by a factor two compared to the previous Haskell code, but since I'll ultimately be dealing in ratios, it doesn't matter. What this output indicates is that the sum 0 occurs three times, the sum 2 appears 51 times, and so on.
This is where I, in my Haskell code, dropped down to a few ephemeral REPL-based queries that enabled me to collect enough information to paste into Excel in order to produce a figure. In Python, however, I have Matplotlib, which means that I can create the desired plots entirely in code. It does require that I write a bit more code, though.
First, I need to calculate the range of the Probability Mass Function (PMF), since there are values that are possible, but not represented in the above data set. To calculate all possible values in the PMF's range, I use combinations_with_replacement against the Danish grading scale.
grade_scale = [-3, 0, 2, 4, 7, 10, 12]
sumOfGradesRange = set(map(sum, combinations_with_replacement(grade_scale, 2)))
sumOfGradesRange = sorted(sumOfGradesRange)
print(f'Range of sums of grades: {sumOfGradesRange}')
The output is this:
Range of sums of grades: [-6, -3, -1, 0, 1, 2, 4, 6, 7, 8, 9, 10, 11, 12, 14, 16, 17, 19, 20, 22, 24]
Next, I create a dictionary of all possible grades, initializing all entries to zero, but then updating that dictionary with the observed values, where they are present:
probs = dict.fromkeys(sumOfGradesRange, 0)
probs.update(dict(sumOfGrades))
Finally, I recompute the dictionary entries to probabilities.
total = sum(x[1] for x in sumOfGrades)
for k, v in probs.items():
    probs[k] = v / total
Now I have all the data needed to plot the desired bar char:
plt.bar(probs.keys(), probs.values())
plt.xlabel('Sum')
plt.ylabel('Probability')
plt.show()
The result looks like this:
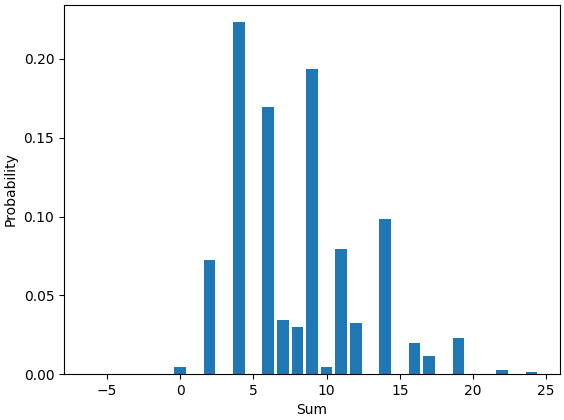
While I'm already on line 34 in my Python file, with one more question to answer, I've written proper code in order to produce data that I only wrote ephemeral queries for in Haskell.
Difference of experiences #
The next question is almost a repetition of the the first one, and I've addressed it by copying and pasting. After all, it's only duplication, not triplication, so I can always invoke the Rule of Three. Furthermore, this is a one-off script that I don't expect to have to maintain in the future, so copy-and-paste, here we go:
diffOfExperiances = \
    Counter(map(lambda x: abs(x[0] - x[1]), combinations(experiences, 2)))
diffOfExperiances = sorted(diffOfExperiances.items(), key=lambda item: item[0])
print(f'Differences of experiences: {diffOfExperiances}')

experience_scale = list(range(1, 8))
diffOfExperiancesRange = set(\
    map(lambda x: abs(x[0] - x[1]),\
    combinations_with_replacement(experience_scale, 2)))
diffOfExperiancesRange = sorted(diffOfExperiancesRange)

probs = dict.fromkeys(diffOfExperiancesRange, 0)
probs.update(dict(diffOfExperiances))
total = sum(x[1] for x in diffOfExperiances)
for k, v in probs.items():
    probs[k] = v / total

# Plot the histogram of differences of experiences
plt.bar(probs.keys(), probs.values())
plt.xlabel('Difference')
plt.ylabel('Probability')
plt.show()
The bar chart has the same style as before, but obviously displays different data. See the bar chart in the previous article for the Excel-based rendition of that data.
Conclusion #
The Python code runs to 61 lines of code, compared with the 34 lines of Haskell code. The Python code, however, is much more complete than the Haskell code, since it also contains the code that computes the range of each PMF, as well as code that produces the figures.
Like the Haskell code, it took me a couple of hours to produce this, so I can't say that I feel much more productive in Python than in Haskell. On the other hand, I also acknowledge that I have less experience writing Python code. If I had to do a lot of ad-hoc data crunching like this, I can see how Python is useful.
