Trying to fit the hype cycle by Mark Seemann
An amateur tries his hand at linear modelling.
About a year ago, I was contemplating a conference talk I was going to give. Although I later abandoned the idea for other reasons, for a few days I was thinking about using the Gartner hype cycle for an animation. What I had in mind would require me to draw the curve in a way that would enable me to zoom in and out. Vector graphics would be much more useful for that job than a bitmap.
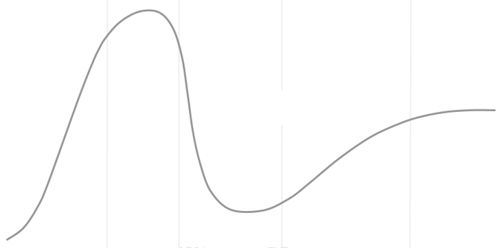
Along the way, I considered if there was a function that would enable me to draw it on the fly. A few web searches revealed the Cross Validated question Is there a linear/mixture function that can fit the Gartner hype curve? So I wasn't the first person to have that idea, but at the time I found it, the question was effectively dismissed without a proper answer. Off topic, dontcha know?
A web search also seems to indicate the existence of a few research papers where people have undertaken this task, but there's not a lot about it. True, the Gartner hype cycle isn't a real function, but it sounds like a relevant exercise in statistics, if one's into that kind of thing.
Eventually, for my presentation, I went with another way to illustrate what I wanted to say, so for half I year, I didn't think more about it.
Linear regression? #
Recently, however, I was following a course in mathematical analysis of data, and among other things, I learned how to fit a line to data. Not just a straight line, but any degree of polynomial. So I thought that perhaps it'd be an interesting exercise to see if I could fit the hype cycle to some high-degree polynomial - even though I do realize that the hype cycle isn't a real function, and neither does it look like a straight polynomial function.
In order to fit a polynomial to the curve, I needed some data, so my first task was to convert an image to a series of data points.
I'm sure that there are online tools and apps that offer to do that for me, but the whole point of this was that I wanted to learn how to tackle problems like these. It's like doing katas. The journey is the goal.
This turned out to be an exercise consisting of two phases so distinct that I wrote them in two different languages.
As the articles will reveal, the first part went quite well, while the other was, essentially, a fiasco.
Conclusion #
There's not much point in finding a formula for the Gartner hype cycle, but the goal of this exercise was, for me, to tinker with some new techniques to see if I could learn from doing the exercise. And I did learn something.
In the next articles in this series, I'll go over some of the details.
